


In today's digital landscape, front-end development holds significant importance, presenting ongoing challenges and demanding continual technological advancements. Online debugging of JavaScript (JS) code is common for experienced front-end developers.
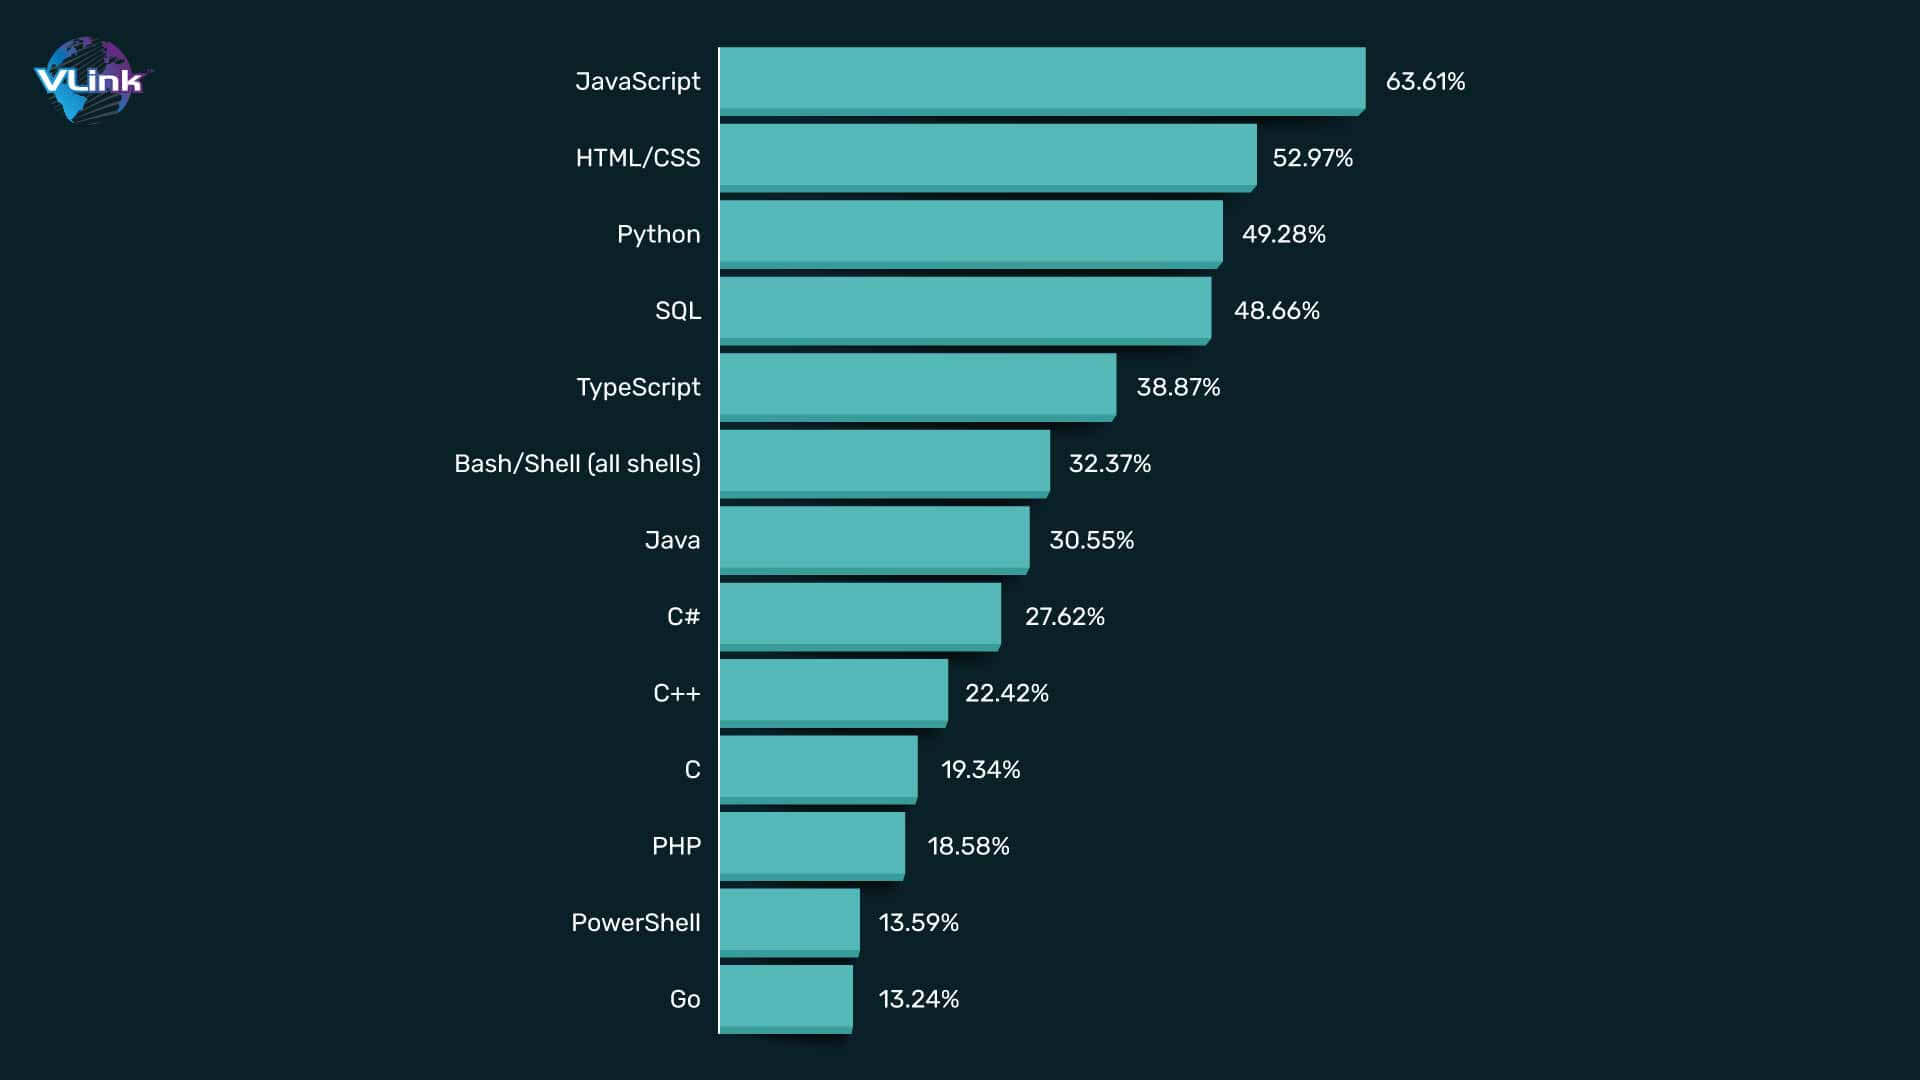
JavaScript debugging tools help identify errors, debug them, and manage them. In addition, they reduce error resolution time, ensuring your customers stay happy.
This blog will explore the top 7 JavaScript debugging tools for 2024 & beyond.
What is a JavaScript Debugging Tool?
A JavaScript Debugging Tool is software designed to aid developers in identifying and resolving issues within their JavaScript code. These tools provide features such as breakpoints, step-by-step execution, variable inspection, and console output monitoring. They enable developers to efficiently debug their code, track down errors, analyze performance, and improve the overall quality of JavaScript applications.

What are the Different Types of JS Debugging Tools?
Here are five types of Javascript debugging tools:
Browser Developer Tools: Built-in tools in web browsers like Chrome Developer Tools, Firefox Developer Tools, and Microsoft Edge Developer Tools.
Standalone Debugging Tools: Independent tools like Node.js debugger allow JavaScript code to be debugged when running outside a browser environment.
IDE Debugging: Integrated development environments (IDEs) like Visual Studio Code, WebStorm, and Atom offer debugging features integrated directly into the coding environment.
Remote Debugging: Tools like RemoteDebug allow developers to debug JavaScript code on remote devices or browsers.
Logging and Error Monitoring Tools: Services like Sentry, LogRocket, and Rollbar provide real-time error tracking and logging for JavaScript applications.
These tools are perfect for different needs in debugging Javascript code, whether in a web browser, server-side environment or during mobile and web app development & deployment phase.
Top JavaScript Debugging Tools for 2024 & Beyond
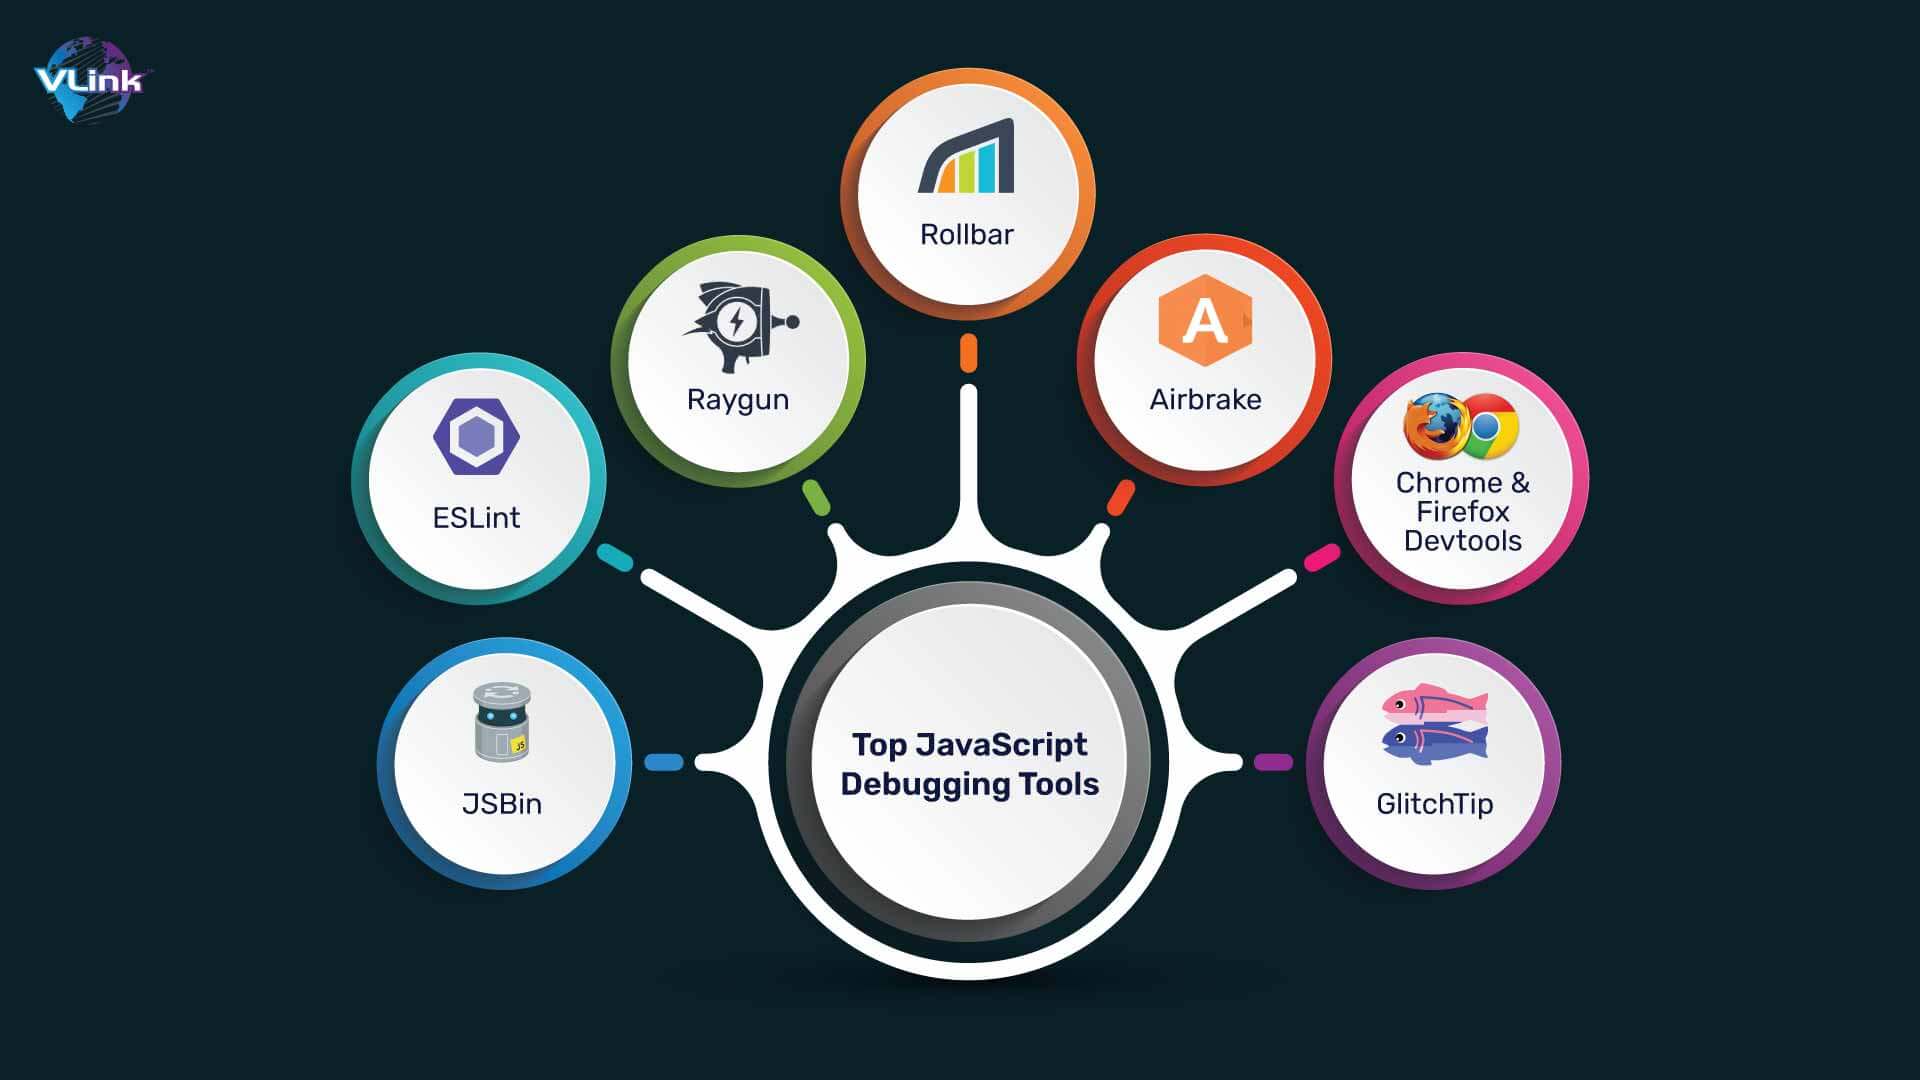
#1 - JSBin
As an open-source, JSBin allows developers to test and debug their code snippets in a real-world setting. That's why it comes first among our top Javascript debugging tools for 2024 & beyond.
JSBin is a useful tool for developers working with HTML, CSS, and JavaScript. Thanks to its simple interface and live code display, programmers can deliver projects faster and more efficiently.
Benefits and features of JSBin:
Real-Time Collaboration
JavaScript Linting for maintaining clean and error-free code
Remote Rendering to increase flexibility and accessibility
Custom Templates
Drag and Drop Editing
CodeCast for sharing code in real-time
How to Use JSBin?
With JSBin, you can write, run, and debug your code directly in your browser. So, there is no need to install an entire development environment.
Here's how you can benefit from JS Bin:
Isolated testing
Real-time feedback
Collaboration
#2 - ESLint
If you need a Javascript debugging tool to analyze static code, ESLint is the right choice. It's an open-source JS linting utility that helps you catch errors, bugs, stylistic issues, and suspicious constructs.
ESLint allows developers to identify issues before executing code, saving time and effort in the debugging process.
Benefits and Features of ESLint:
Here are some benefits and features of why ESLint stands in the second position in our list of top JavaScript debugging tools for 2024 & beyond.
Syntax error detection
Bug detection
Customizability
Seamless integration with popular Java IDEs and code editors
Highly modular and flexible
How to Use ESLint?
To begin utilizing ESLint, developers integrate it into their development environment. It's conveniently accessible as a Node package, simplifying setup within projects. Numerous widely-used code editors like Sublime Text 3 and VS Code feature ESLint plugins, providing immediate insights into code quality.
ESLint scans for errors, offers improvement suggestions, and addresses specific issues. Furthermore, ESLint empowers developers by allowing customization of rules and plugins to suit project requirements.
#3 - Raygun
Raygun is a cloud-based platform for performance monitoring and debugging. It ensures your web and mobile apps are free of bugs. It has expertise in JS error monitoring and offers several features to detect and fix issues quickly.
This tool can also track service-side performance and end-user fault detection analysis. In addition, it can be integrated with third-party tools like Jira for bug tracking and analysis.
Because of all these things, we keep it in our list of top JavaScript debugging tools for 2024 & beyond.
Benefits and Features of Raygun:
Real-time code-level insights
Quick identification and resolution
Ease of use
Real-time deployment monitoring
Supports integrations
Smart filtering options
How to Use It?
You can integrate Raygun into their workflow with just a few lines of code. After integration, this tool provides real-time insights into your app's performance.
One of the most popular Javascript debugging tools makes it easy to add contextual information. It ensures you have all the details to diagnose and resolve issues effectively.
#4 - Rollbar
Rollbar is another top Javascript debugging tool for 2024 & beyond. It comes with options for deployment monitoring, exception reporting, and real-time error notifications. This real-time error tracking and monitoring tool empowers the development team to deliver top-notch software.
As Rollbar offers detailed information and alerts, it helps developers maintain the best software quality throughout the development process. In addition, this tool has workflow triggers that notify developers so they can resolve them before release.
Benefits & Features of Rollbar:
Real-time error reporting
Fault aggregation
Continuous deployment monitoring
Telemetry for faster debugging
Exception reporting
Automate error response
How to Use Rollbar?
Developers integrate Rollbar into their JavaScript projects by adding its SDK, enabling real-time error monitoring. The Rollbar captures and reports errors, providing detailed information like stack traces and affected user sessions. Developers can then analyze and prioritize issues, improving code quality and ensuring a smoother user experience.
#5 - Airbrake
Another of the best JavaScript debugging tools for developers is Airbrake. It allows them to track app performance and errors.
Whether you want to build in specific software languages such as JS, PHP, Python, Java, or any other language, Airbrake is a highly beneficial tool. It integrates seamlessly into your development process to quickly recognize and fix issues.
Benefits & Features of Airbrake:
Deployment tracking
Real-time error alerts
Performance monitoring
Error monitoring
Integration with project management tools
Agentless and serverless
How to Use It?
To use Airbrake, developers integrate its JavaScript library into their projects. This library automatically captures errors in web applications and sends them to the Airbrake dashboard. Developers can then monitor, prioritize, and resolve issues efficiently, ensuring better code quality and a more reliable user experience.
#6 - Chrome & Firefox Devtools
These JavaScript debugging tools allow developers to test their JS code locally on the Chrome and Firefox browsers. Also known as devtools, Chrome & Firefox Devtools enable users to advance the code improvement process and improve the quality of use.
Benefits and features of Chrome & Firefox Devtools:
Step-by-step debugging
Evaluate expressions
Multi-browser debugging
Real-time editing
Network analysis
How to Use It?
To use Chrome and Firefox DevTools, open your browser's developer console (Ctrl+Shift+I or right-click and select "Inspect"). DevTools provides tabs for inspecting HTML/CSS, debugging JavaScript, analyzing network activity, optimizing performance, and more.
Developers can utilize various features like breakpoints, console logging, and DOM inspection for effective debugging and development.
#7 - GlitchTip
This open-source debugger allows developers to review and modify JavaScript modules. They can use this tool for error tracking and logging through log messages and exceptions. It makes it a valuable addition to the suit of tools.
Benefits & Features of GlitchTip:
Open-Source Error Monitoring
Customization and Control
Error Aggregation and Reporting
Integration and Collaboration
How to Use It?
To use GlitchTip, developers first integrate its client-side JavaScript library into their web applications. This library captures errors and sends them to the GlitchTip server. Developers then access the GlitchTip dashboard to monitor, analyze, and prioritize errors, facilitating efficient debugging and improving overall application reliability.
How to Choose the Right JavaScript Debugging Tools?
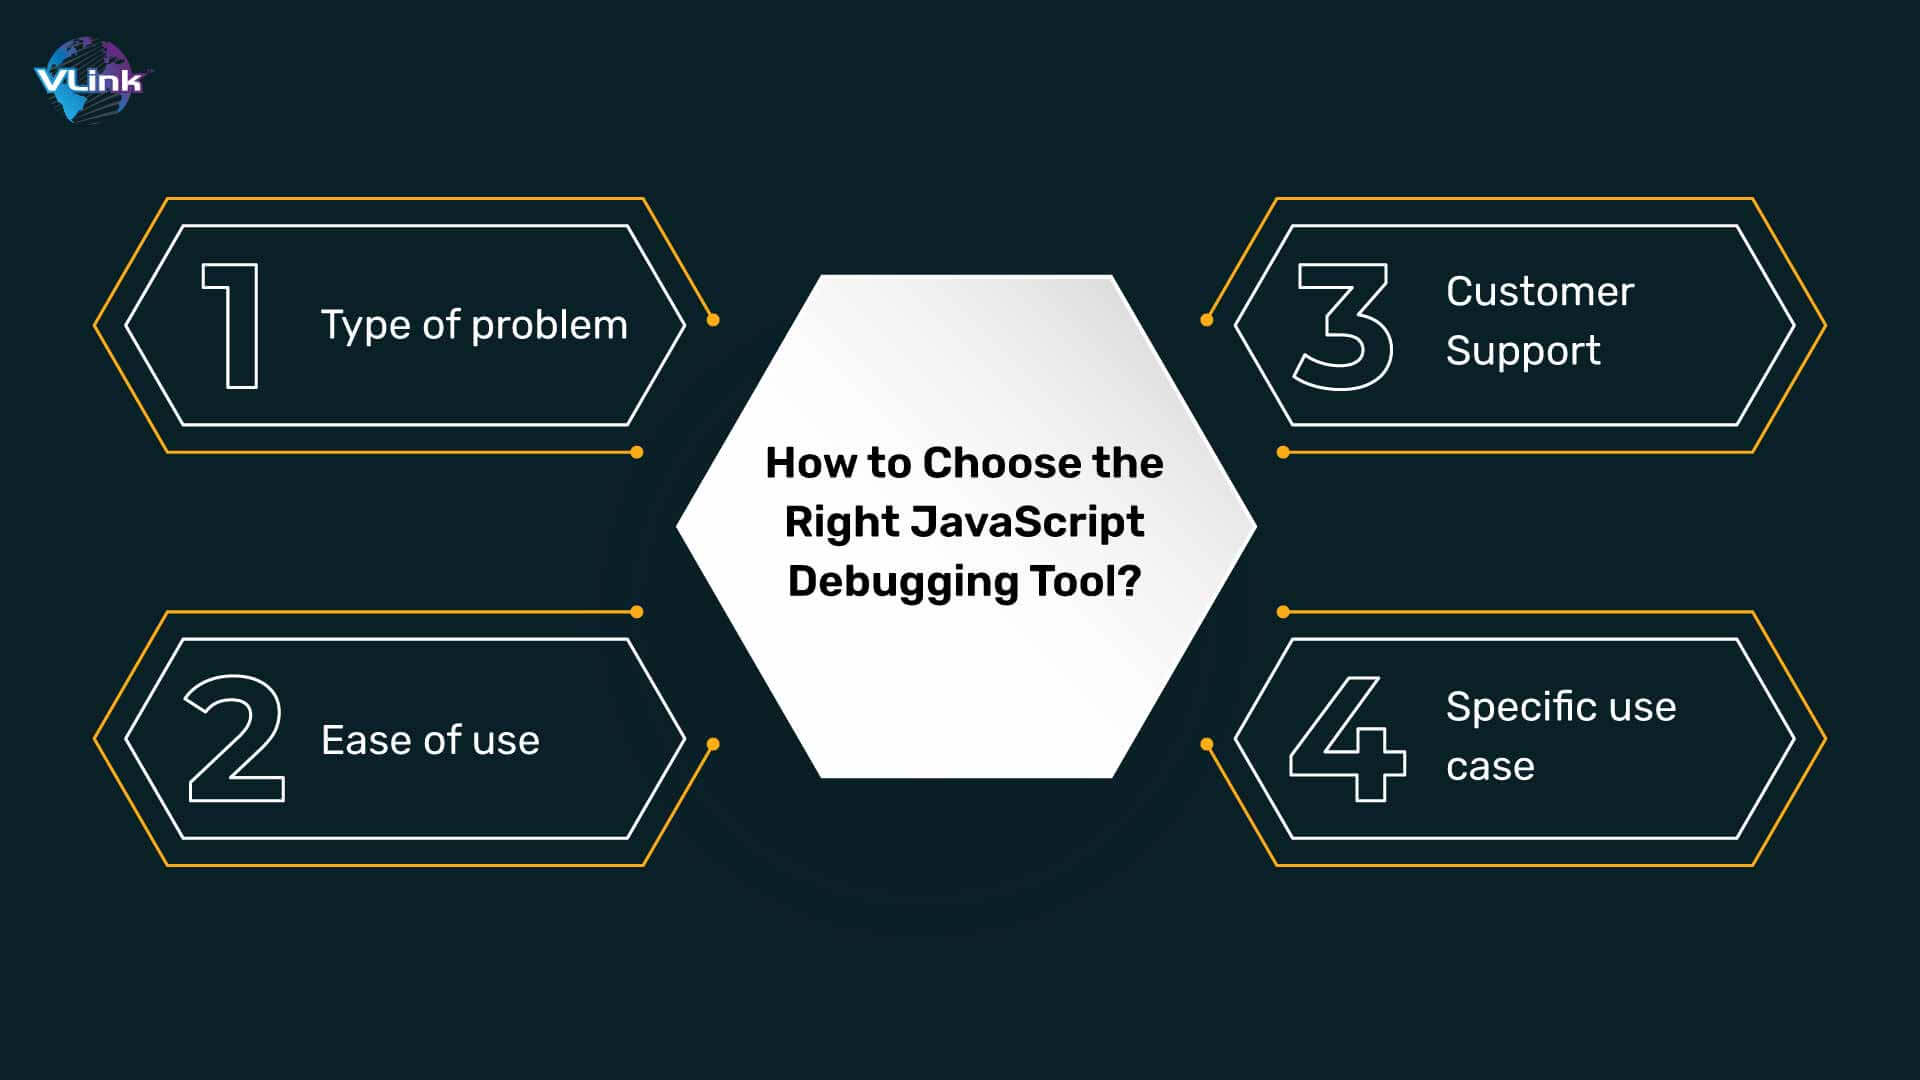
Here are a few things you need to consider when selecting the right JavaScript debugging tools:
#1 Problem Types
When choosing the right debugging tool, it's essential to understand the exact issue.
For example, Airbrake or Raygun are valuable tools to debug performance issues. If you need to debug your style errors, use ESLint.
#2 Ease of use
Ensure your debugging tools have a simple learning curve and are easy to use. Admins with limited testing knowledge can use it to generate reports and schedule notifications. It should be easy to integrate into your existing infrastructure.
#3 Customer Support
Before choosing the right JavaScript debugging tool, consider it should have good after-sales support. In addition, it should include all online resources and documentation to support its users.
Ensure your chosen tool has an online community to help users resolve complex issues.
#4 Specific use case
As a developer, you should choose debugging tools based on your user case.
For example:
If you are debugging a Node.js application, choose a Node.js debugger instead of a standalone one.
Here are the 7 best Javascript debugging tools for developers. Considering these steps, you can select the right Javascript tool for your project. In addition, you can hire developers to take your projects to the next level.

Take your JavaScript Debugging to the Next Level with VLink!
At VLink, elevate your JavaScript debugging with our experts! Our developers specialize in the best JavaScript debugging tools that offer advanced features like real-time error tracking, customizable breakpoints, and code profiling.
With an extensive talent network and a streamlined hiring process, you can hire a dedicated team of the top 3% of developers with experience in streamlining your development process, identifying swiftly, and optimizing performance.
Take your debugging to new heights with us and unlock the full potential of your JavaScript projects.
For more information, you can contact us today!

Global Delivery Manager, VLink Inc.
Shivisha Patel serves as the Global Delivery Manager at VLink Inc., bringing a wealth of experience in program delivery and management, particularly in the insurance and banking sectors. She has a robust technical background with deep expertise in WebSphere MQ, WTX, IIB, middleware, and enterprise system integration.

 Shivisha Patel