


If you work in the supply chain, you understand how difficult it can be to monitor measurements. It only gets more challenging when you try to manage many points of sale across several channels.
From a business standpoint, having all relevant data regarding your company's supply chain performance at your fingertips is always critical.
We understand how critical it is to optimize the efficiency of these departments to meet demand and maintain the overall level of business operations. We've discovered that using dashboards is an excellent approach to do this.
In this post, we will discuss how to obtain a dashboard that will offer you fast access to all critical supply chain KPIs and indicators for making sound business choices.
What is a supply chain dashboard?
Supply chain dashboards are wonderful tools for monitoring and evaluating data from numerous sources to enhance the operation of your organization. In simple terms, these business assets allow you to graphically show important information and statistics in an easy-to-read style using charts and graphs.
Every featured supply chain management platform has its own customized dashboard. It is commonly applied in the context of company performance and process improvement. A fully featured supply chain dashboard can help users determine challenges in the processes in a visualized manner and generate reports to analyze the optimization areas.
Dashboards may also assist enhance customer service by delivering accurate and timely information about their purchases by offering real-time visibility into the supply chain and delivery operations. Decision-makers can provide accurate outcomes that help improve the supply chain and shipping operations if they have access to up-to-date and correct information.
These business-friendly tools can also streamline communication between teams and departments engaged in the supply chain and shipping operations. Within three months, companies that employ a dashboard often see a 6% boost in sales. Executives save an additional 20 days each year, with a 90% adoption rate.
Why does a business need a supply chain dashboard?
The production, manufacturing, and supply chain divisions are all critical to a company's success. A user-friendly supply chain dashboard will help to analyze data more easily and visualize the statistics using different sections and tools. And that’s why you need to understand its importance while digitizing your supply chain business.
With a supply chain dashboard, you will be able to track critical data such as response times, inventory levels, staff productivity, and much more. It can be used to analyze large and complex data streams to quickly make sense of them.
Your company’s requirements and business goals will help you make the selection of tools and features in a supply chain dashboard. Additionally, the properties are different according to every business need with their uniqueness.
Dashboards, as visual representations of data, allow rapid and simple access to critical information. Dashboards may give real-time insight into supply chain and shipping activities in the context of supply chain and shipping, allowing stakeholders to immediately detect and handle any issues that may develop.
Tips to create a supply chain dashboard
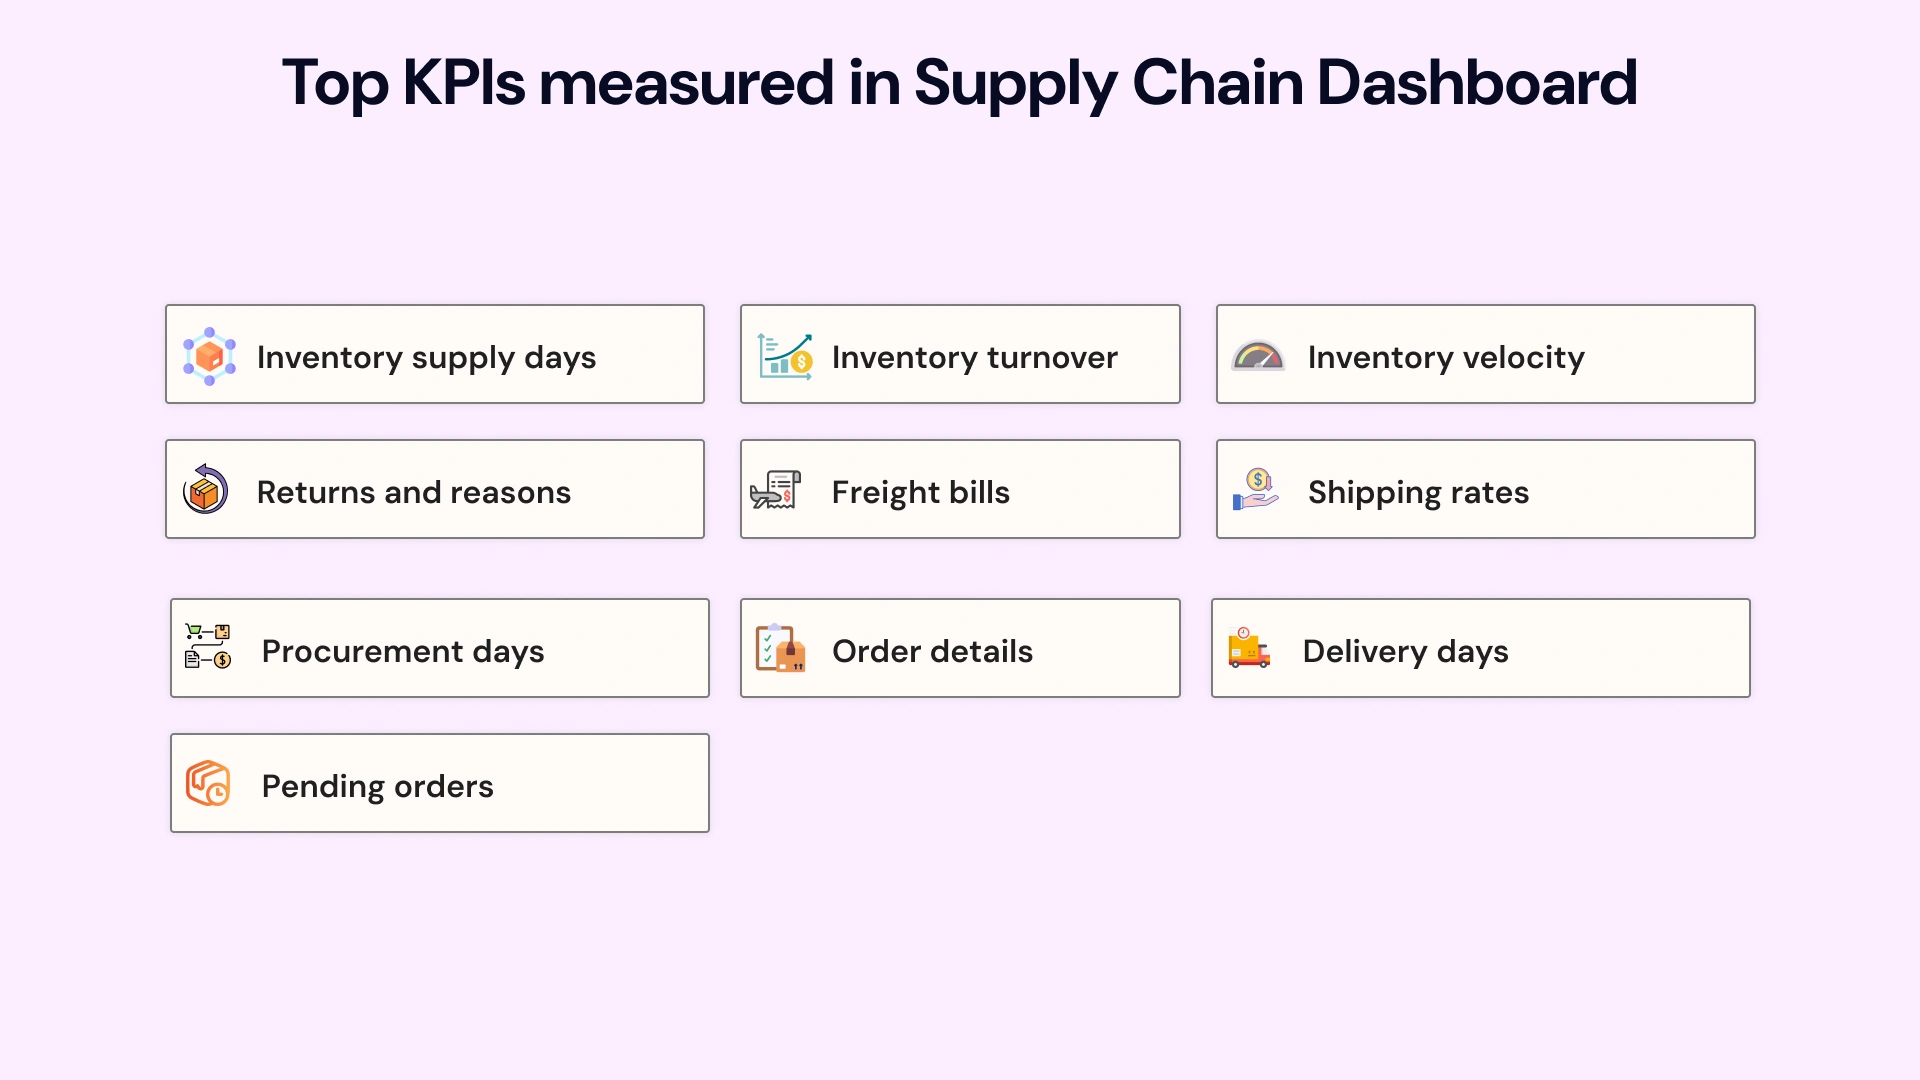
1- Identifying key performance indicators (KPIs)
You must determine which procedures are the most critical. What exactly do you want to optimize? Determine the Key Performance Indicators (KPIs) for the departments of production, manufacturing, and supply chain. For example, if your key performance indicators (KPIs) are time-to-market and inventory levels, an effective dashboard would provide statistics on both issues.
The firm will encounter additional hurdles if the supply chain is not well defined. They may include a lack of foresight, unanticipated operations, payment challenges, and demand vs. supply issues, among other things.
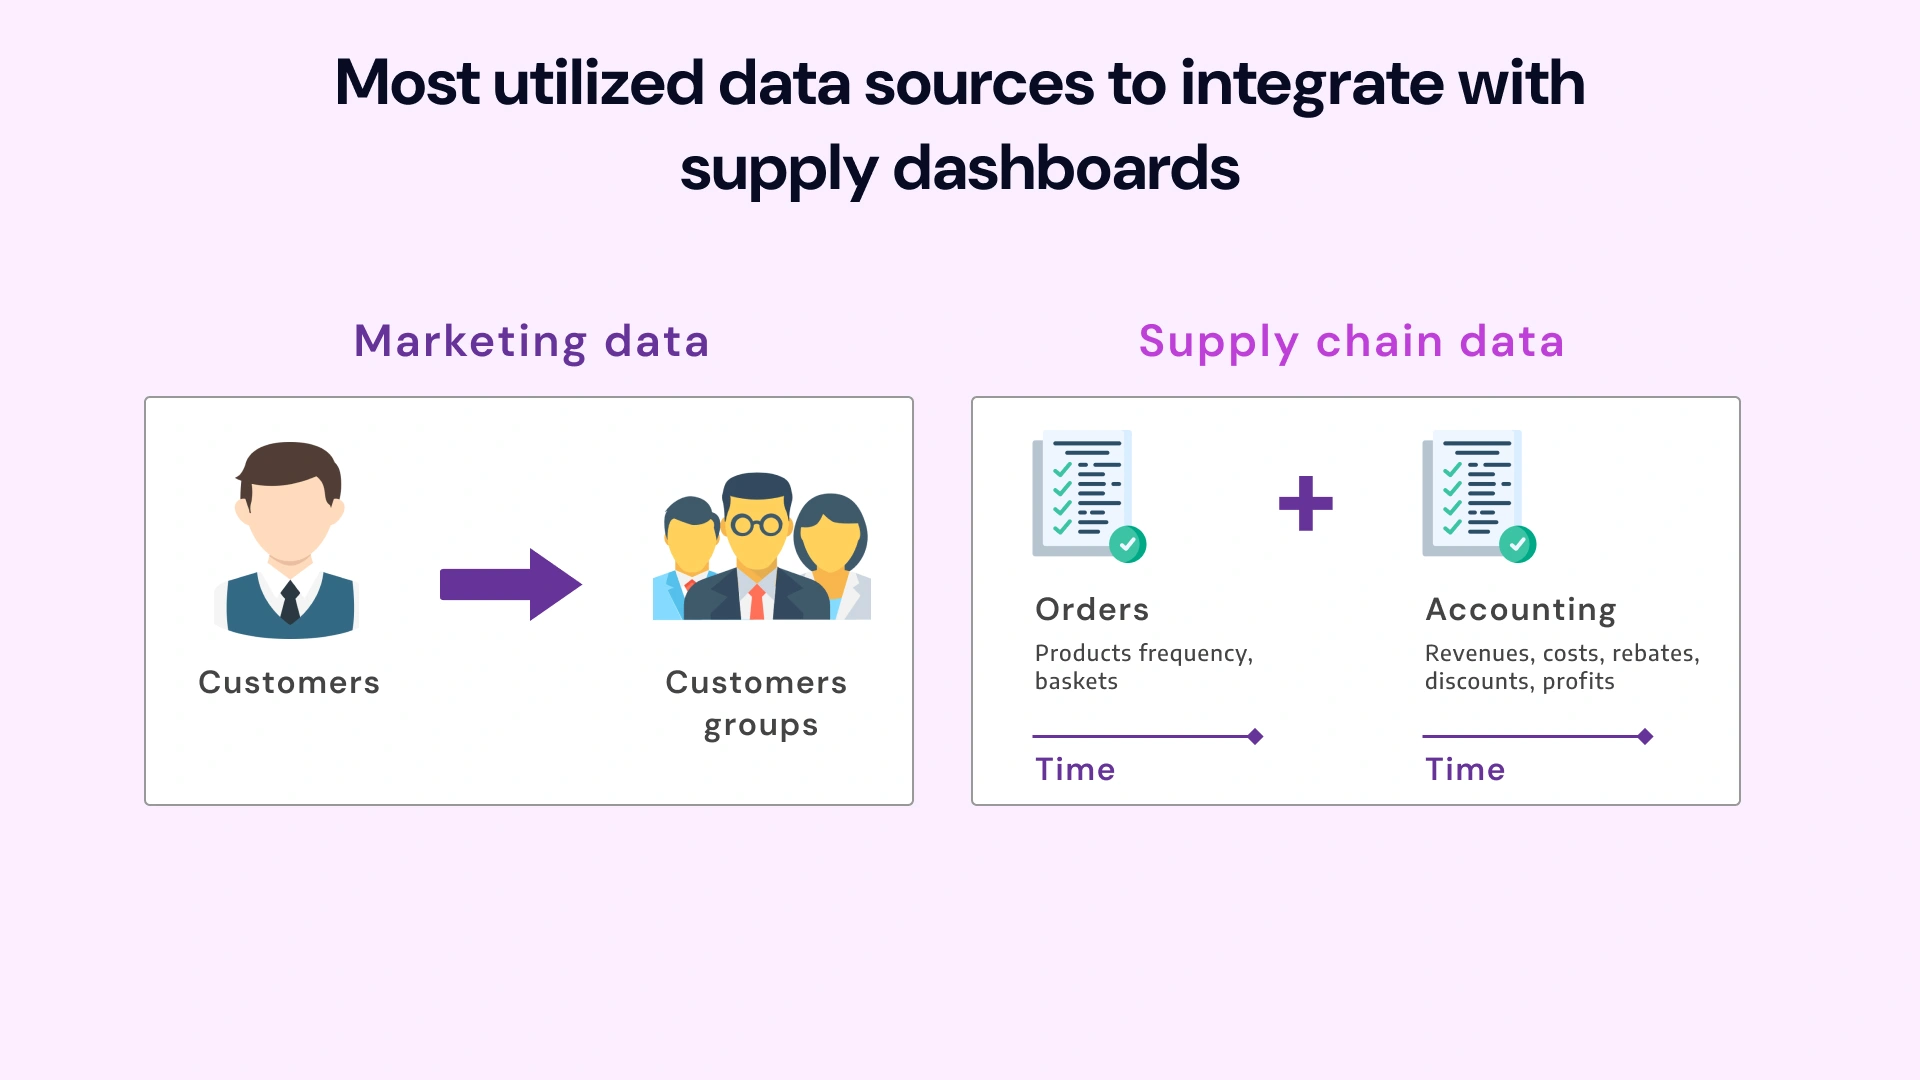
2- Considering reliable data sources
The most time-consuming aspect of switching to a dashboard will be gathering all your data. Consider all the sites where you look for information. Make a list of all sites where data is held that may be centralized.
Keep the talks you had about your KPIs and only submit relevant data for your KPIs, and other department needs for the best outcomes. If you have data that is no longer needed on the dashboard, either delete it or save it someplace for later use.
3- Customizing data visualization
After you've decided on the reliable data sources, consider thinking about graphics. Your dashboard will be most useful if you can arrange and show information in an easy-to-digest fashion for individuals who view it. There are several methods to present this information, but often, using more than one sort of chart or graph available helps you to make your point.
Often, it is preferable to experiment with your data until you discover something that works well for you, and then go from there. Consider what types of charts and visuals will assist you in tracking your KPIs. As an example, if you are tracking daily sales, you might use a line graph.
4- Data usability & analytics
The following step is to make your data usable. Once you've decided on the sort of charts and graphs you want to employ, submit your data and see your graphics come to life! Most platforms will offer a basic step-by-step method.
Once the supply chain dashboard has the data uploaded, you will see how beneficial to make use of that information for making data-driven choices. Make certain that all the charts and graphs are simple to interpret.
For example, if you have a line graph that shows inventory levels over time, make sure the label is suitable and does not need too much interpretation.
5- Access management & data sharing
It is simple to transfer information on to production if you utilize data as a maintenance department. If manufacturing need assistance with production, an issue can be discussed with management before it escalates and impacts other departments.
The ability to transfer data between departments is the most crucial aspect of data in a company context. It would be helpful if you could also come on a regular basis and update the data to keep it current. This method has also gained one of the top preferences among the emerging supply chain trends in the industry.
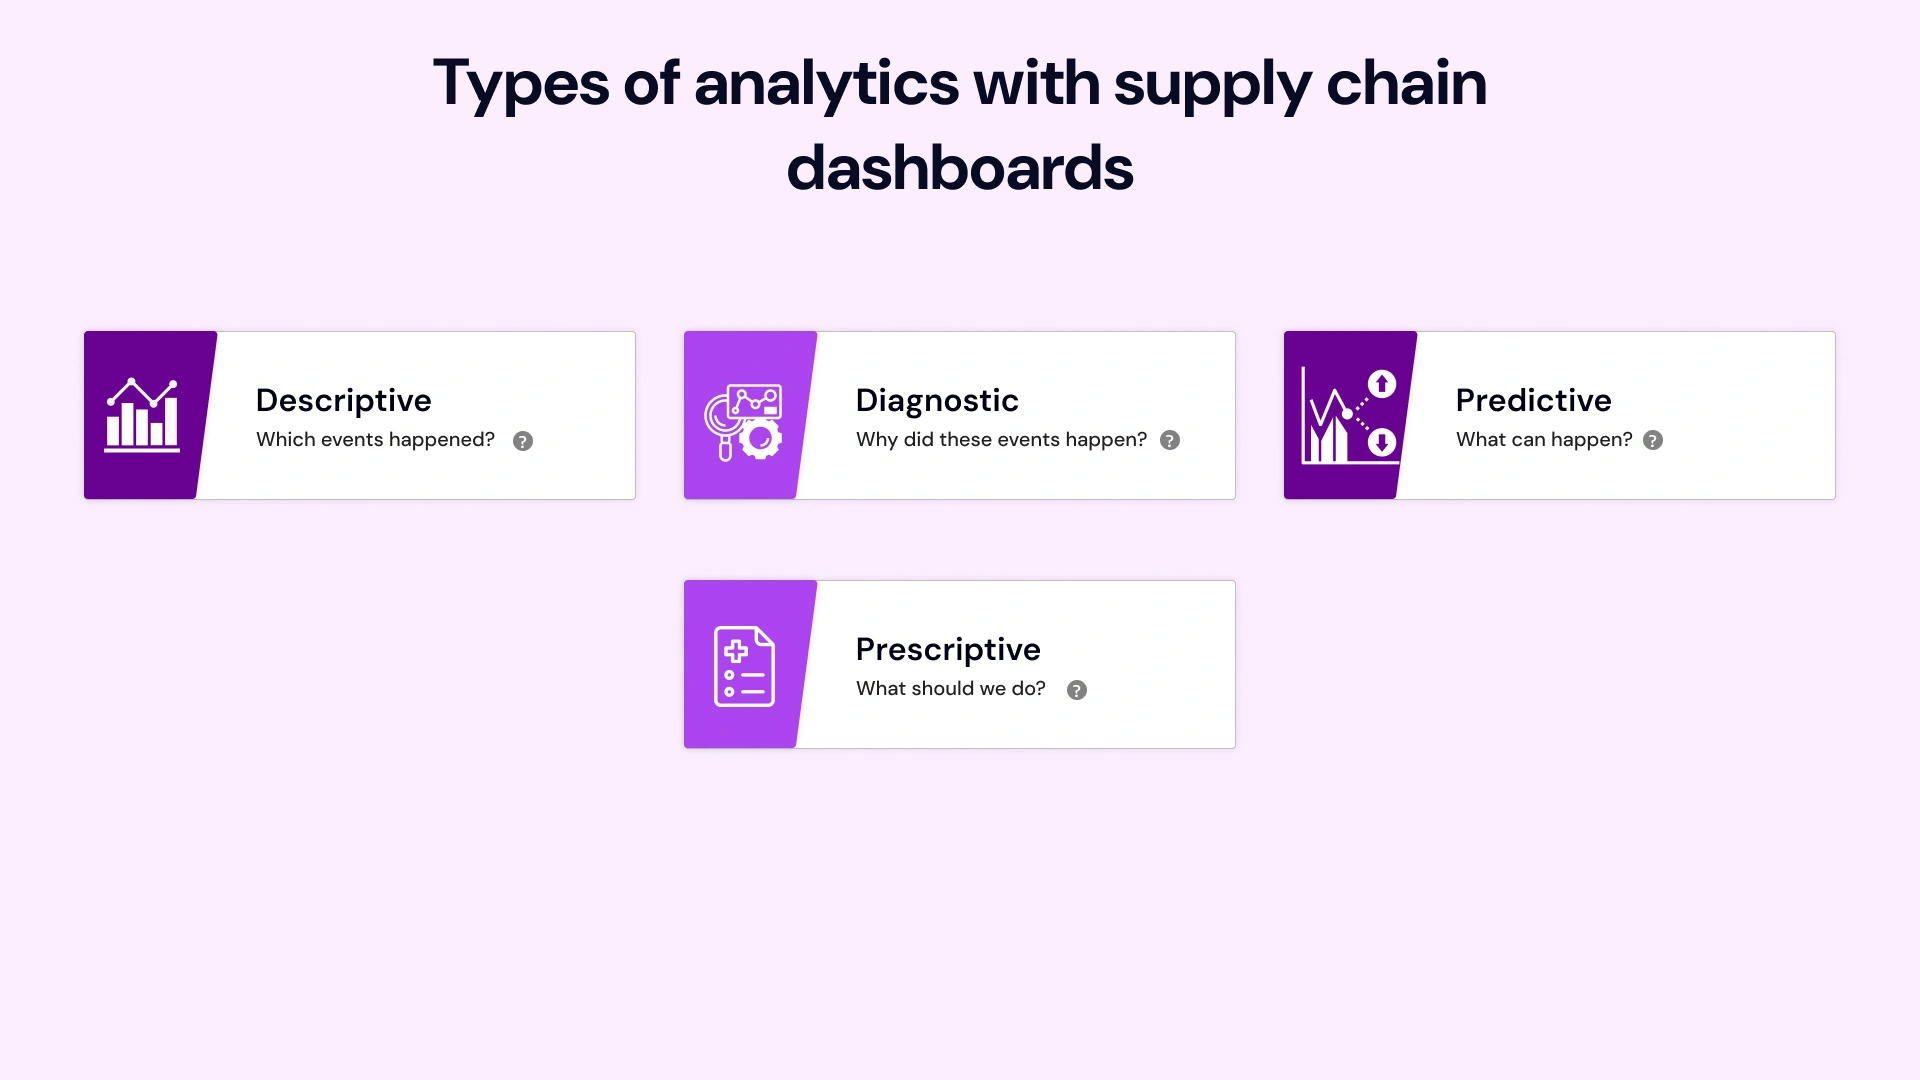
Usage levels of supply chain dashboard
This section examines three types of logistics dashboards, each corresponding to a different degree of supply chain management. When all employees are on the same page, the organization has a better chance of obtaining the attractive supply chain visibility that everyone want.
1- Strategic Level
Strategic dashboards are created for the senior executives of a firm. To monitor KPIs based on reliable and relevant data, C-suite executives want a bird's-eye perspective of the business.
Dashboards assist executives in making long-term choices (for example, how to develop corporate services to satisfy unpredictable market demands, how to reduce operational expenses while increasing revenue) and analyzing business performance on a wide scale.
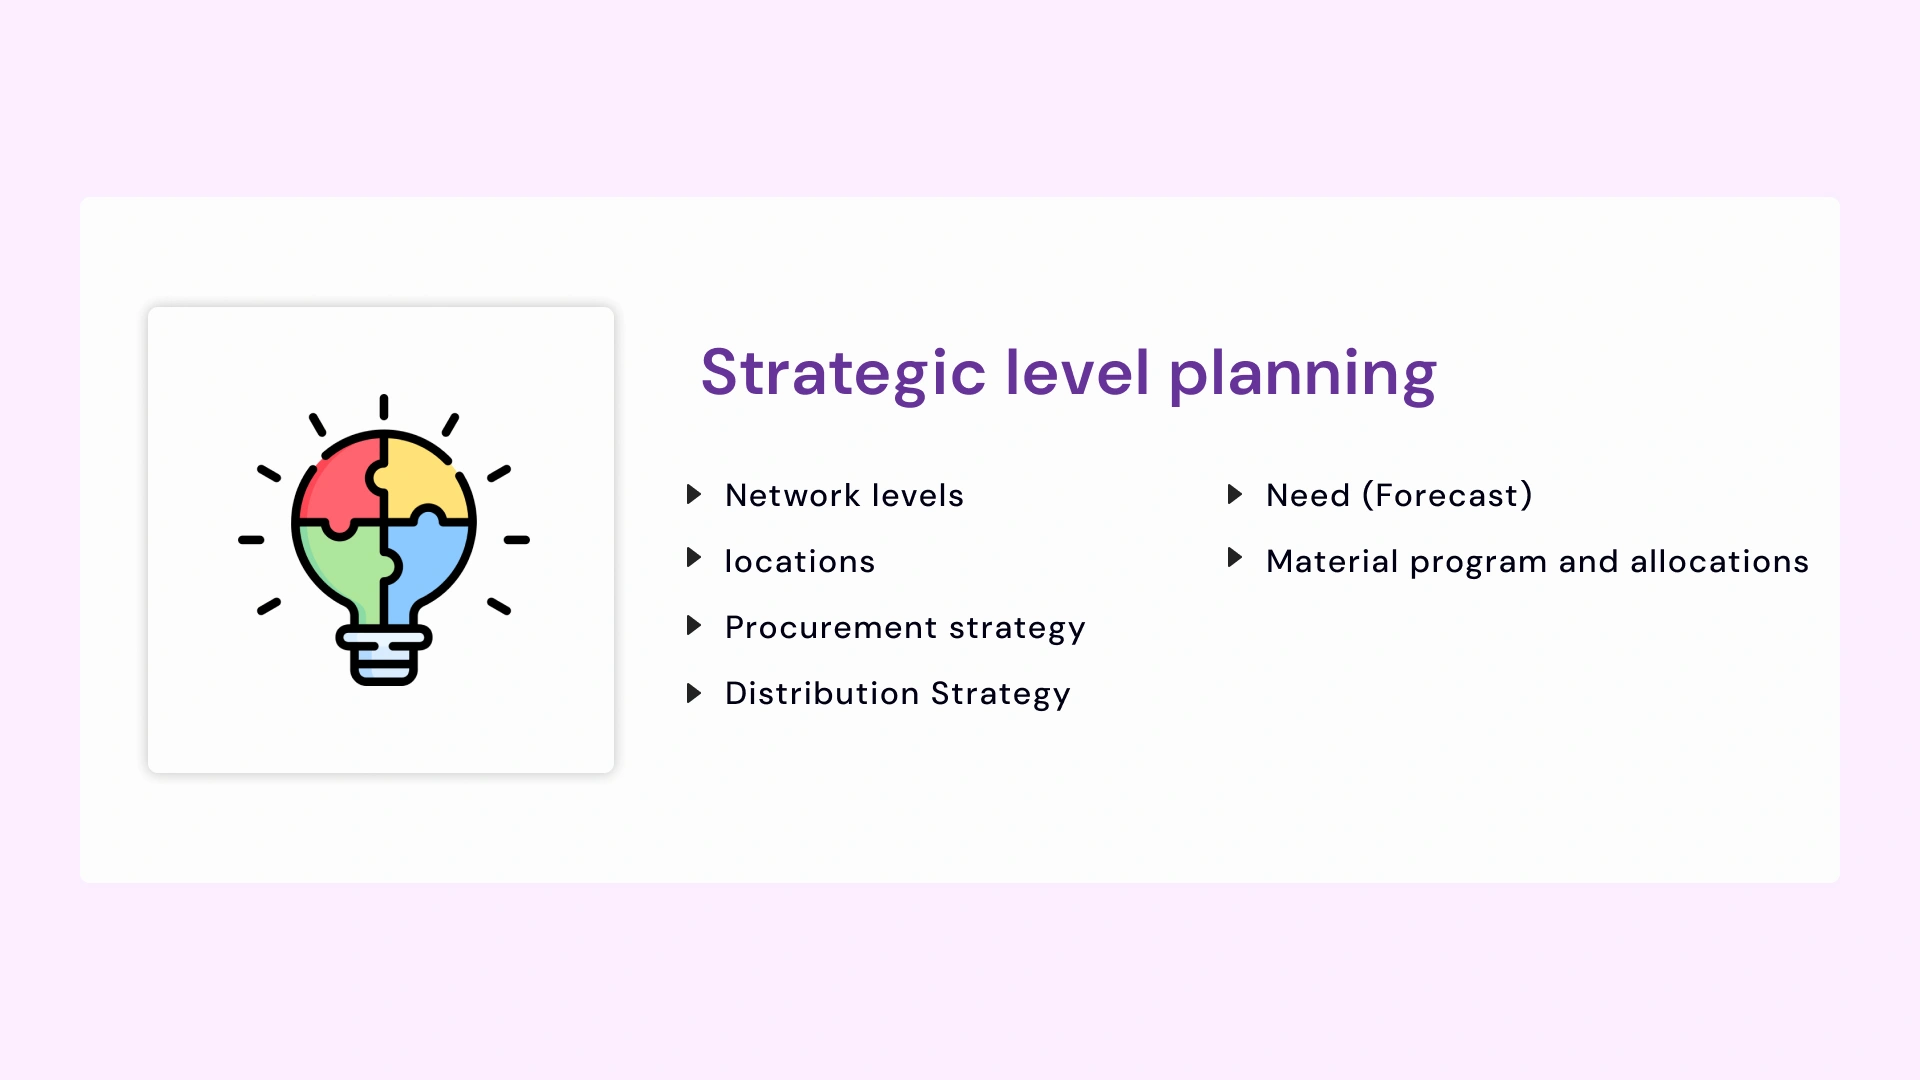
Strategic dashboards will alter depending on the C-level executive. CEOs, CTOs, CFOs, CIOs, and CMOs each want a separate supply chain analytics dashboard, and it is hard to create a unique dashboard that meets all their requirements.
Of course, some of their requirements and interests overlap, but many KPIs are distinct. Let's look at a dashboard that would be of interest to a supply chain COO.
2- Tactical Level
Tactical dashboards that indicate monthly, quarterly, and yearly company performance are used by mid-management teams. Managers may use tactical dashboards to create mid-term organizational goals, which are essentially stages toward reaching full-scale strategic goals.
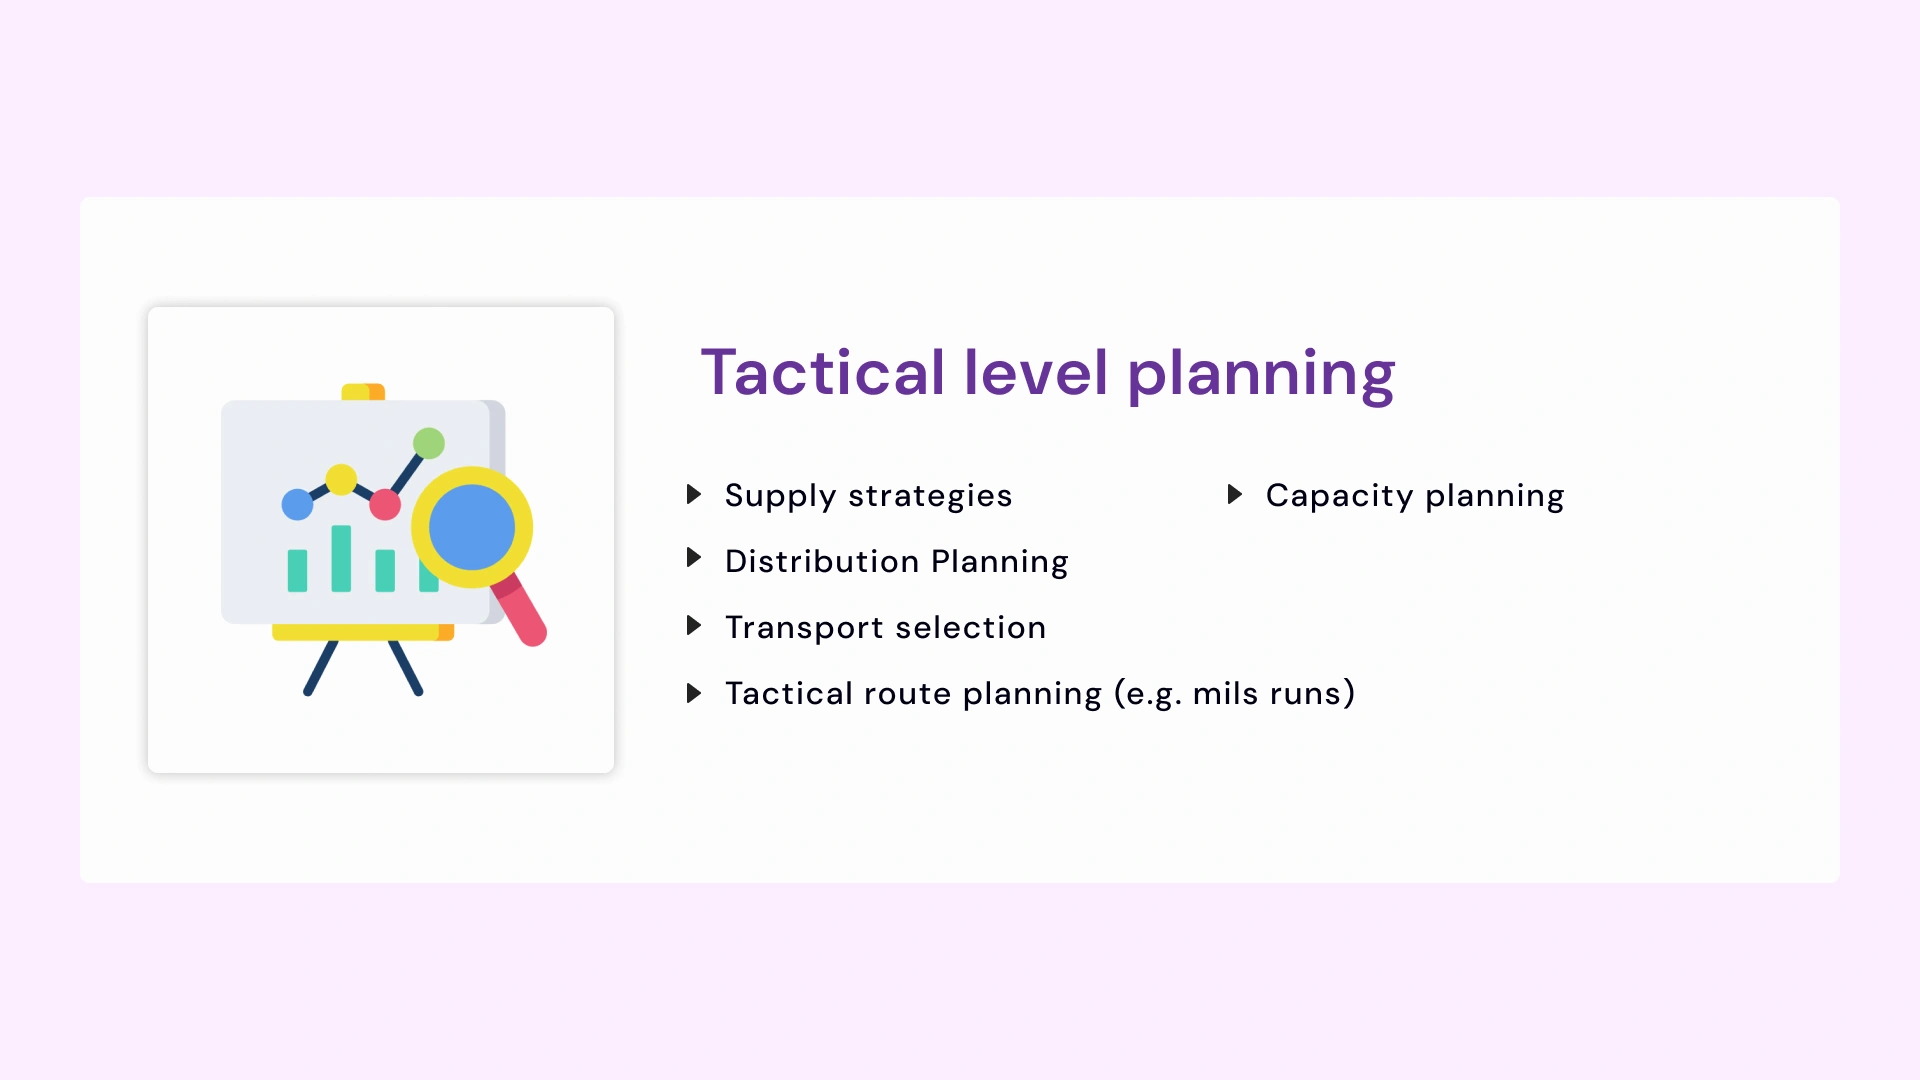
Such dashboards may also indicate if a company is progressing toward strategic goals, as C-level executives may establish targets that are overly ambitious or unachievable.
3- Operational Level
The operational dashboard is the third type. Such dashboards assist logistics managers in monitoring day-to-day supply chain processes such as order fulfillment, manufacturing, load planning, space calculations, and delivery to make required modifications to the workflow. These dashboards make it possible to take even smaller steps toward attaining overall strategic goals.
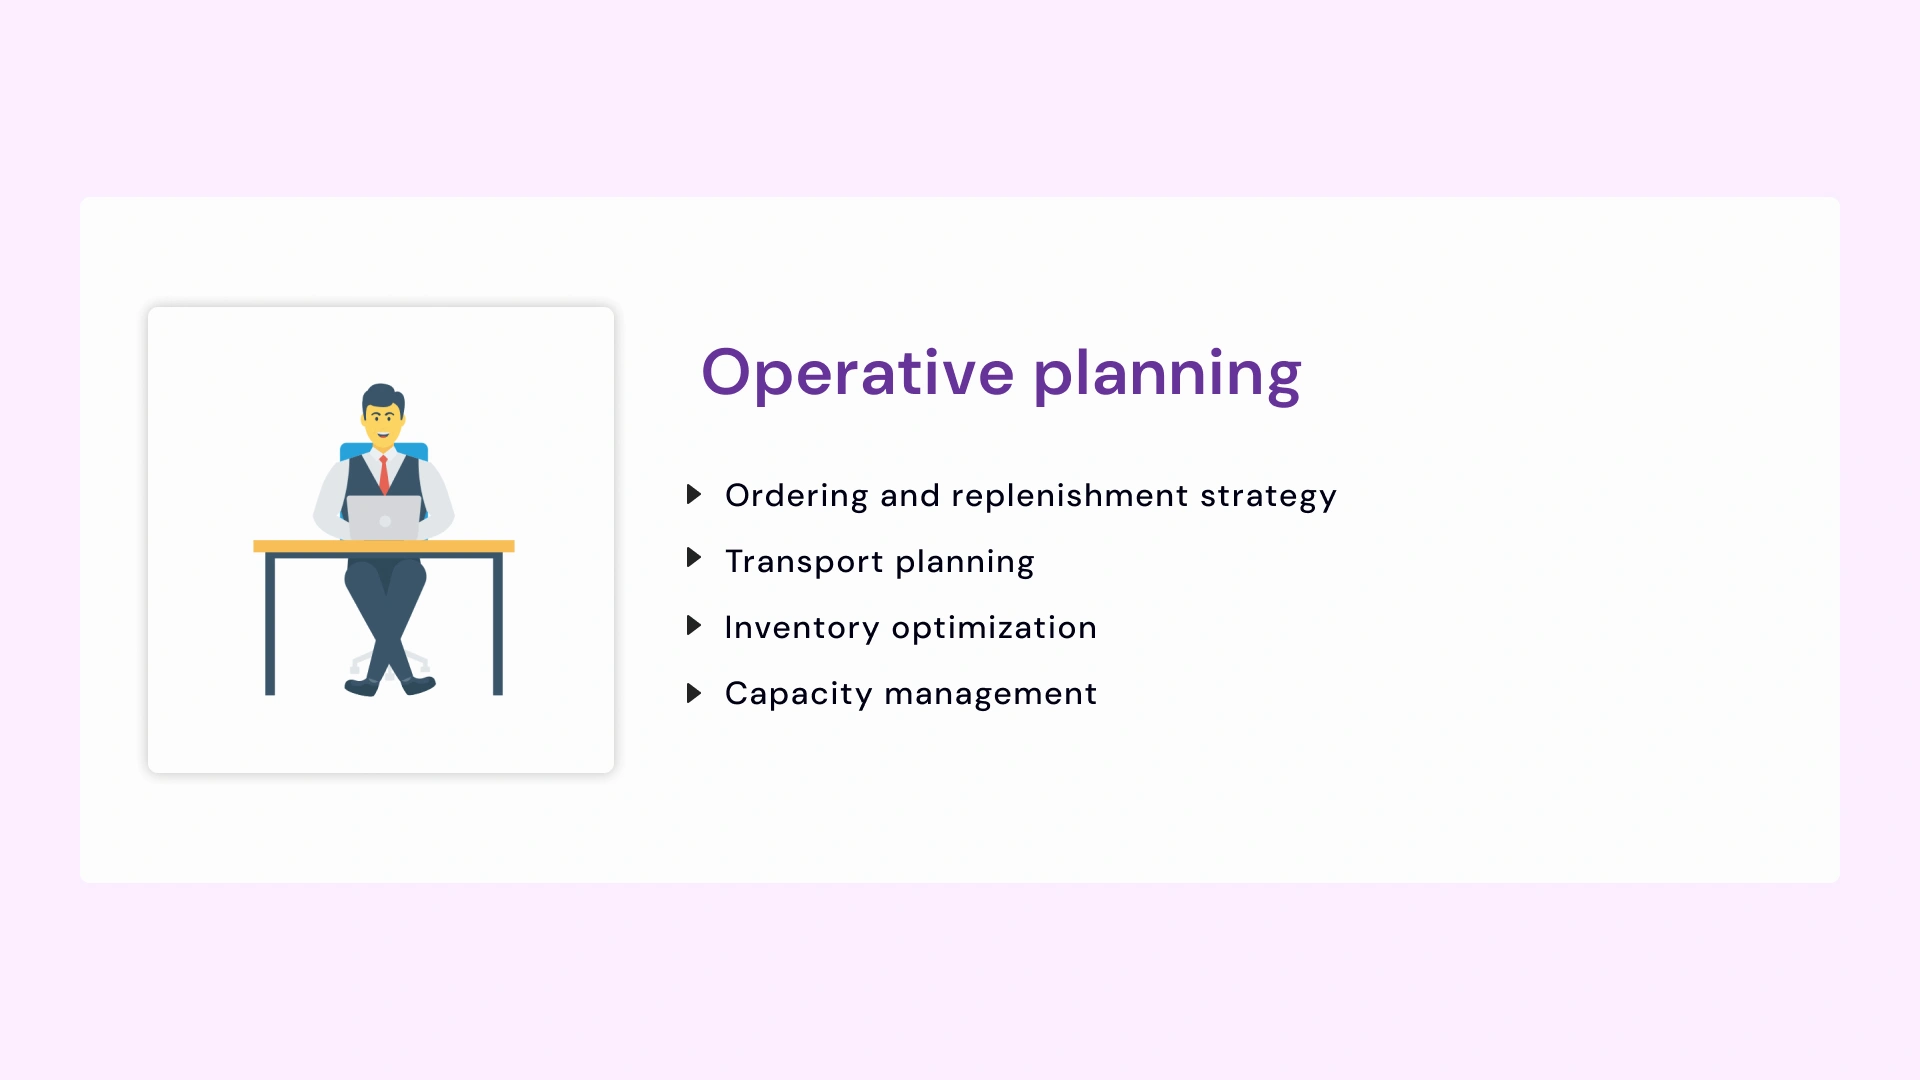
Operational dashboards assist logistics managers in addressing difficult logistical sectors before they affect higher levels. They can accomplish this, for example, by assuring preventative maintenance for equipment with declining performance indicators.
How VLink can help with customized supply chain dashboard development?
A dashboard may be extremely beneficial to production, manufacturing, and supply chain departments. It may assist you in tracking KPIs like never before and keeping the most important aspects of your business organized and efficient!
Each firm is unique, and there is undoubtedly more to the issue when examined individually. If you have any questions, please do not hesitate to contact us. VLink will be delighted to assess your dashboard development requirements and offer our expertise on how to get the most of its bespoke creation.


Global Delivery Manager, VLink Inc.
Shivisha Patel serves as the Global Delivery Manager at VLink Inc., bringing a wealth of experience in program delivery and management, particularly in the insurance and banking sectors. She has a robust technical background with deep expertise in WebSphere MQ, WTX, IIB, middleware, and enterprise system integration.

 Shivisha Patel